


Putting Added Sugars and Sugar Intake into Perspective of the Total Diet
We all know that obesity is a serious problem in the United States. With that in mind it should come as no surprise that as a society we eat more calories and move a lot less than we did 50 years ago1, 2, 3
In 1970, people were consuming 2,054 calories each day. Fast-forward to 2010 (the most recent calorie data), and that figure jumped to 2,501—more than a 20% increase in calories. But added sugars didn’t make up a very big percentage of the increased intake. Over that same period, added sugars consumption increased by 34.5 kcals/day, a 10% increase. Calories from added fats and oils have increased by 229 kcals/day, a 66% increase, and calories from grains have increased by 171 kcals/day, a 42% increase.1 These numbers are based on food availability data, which can be used as a proxy for consumption.
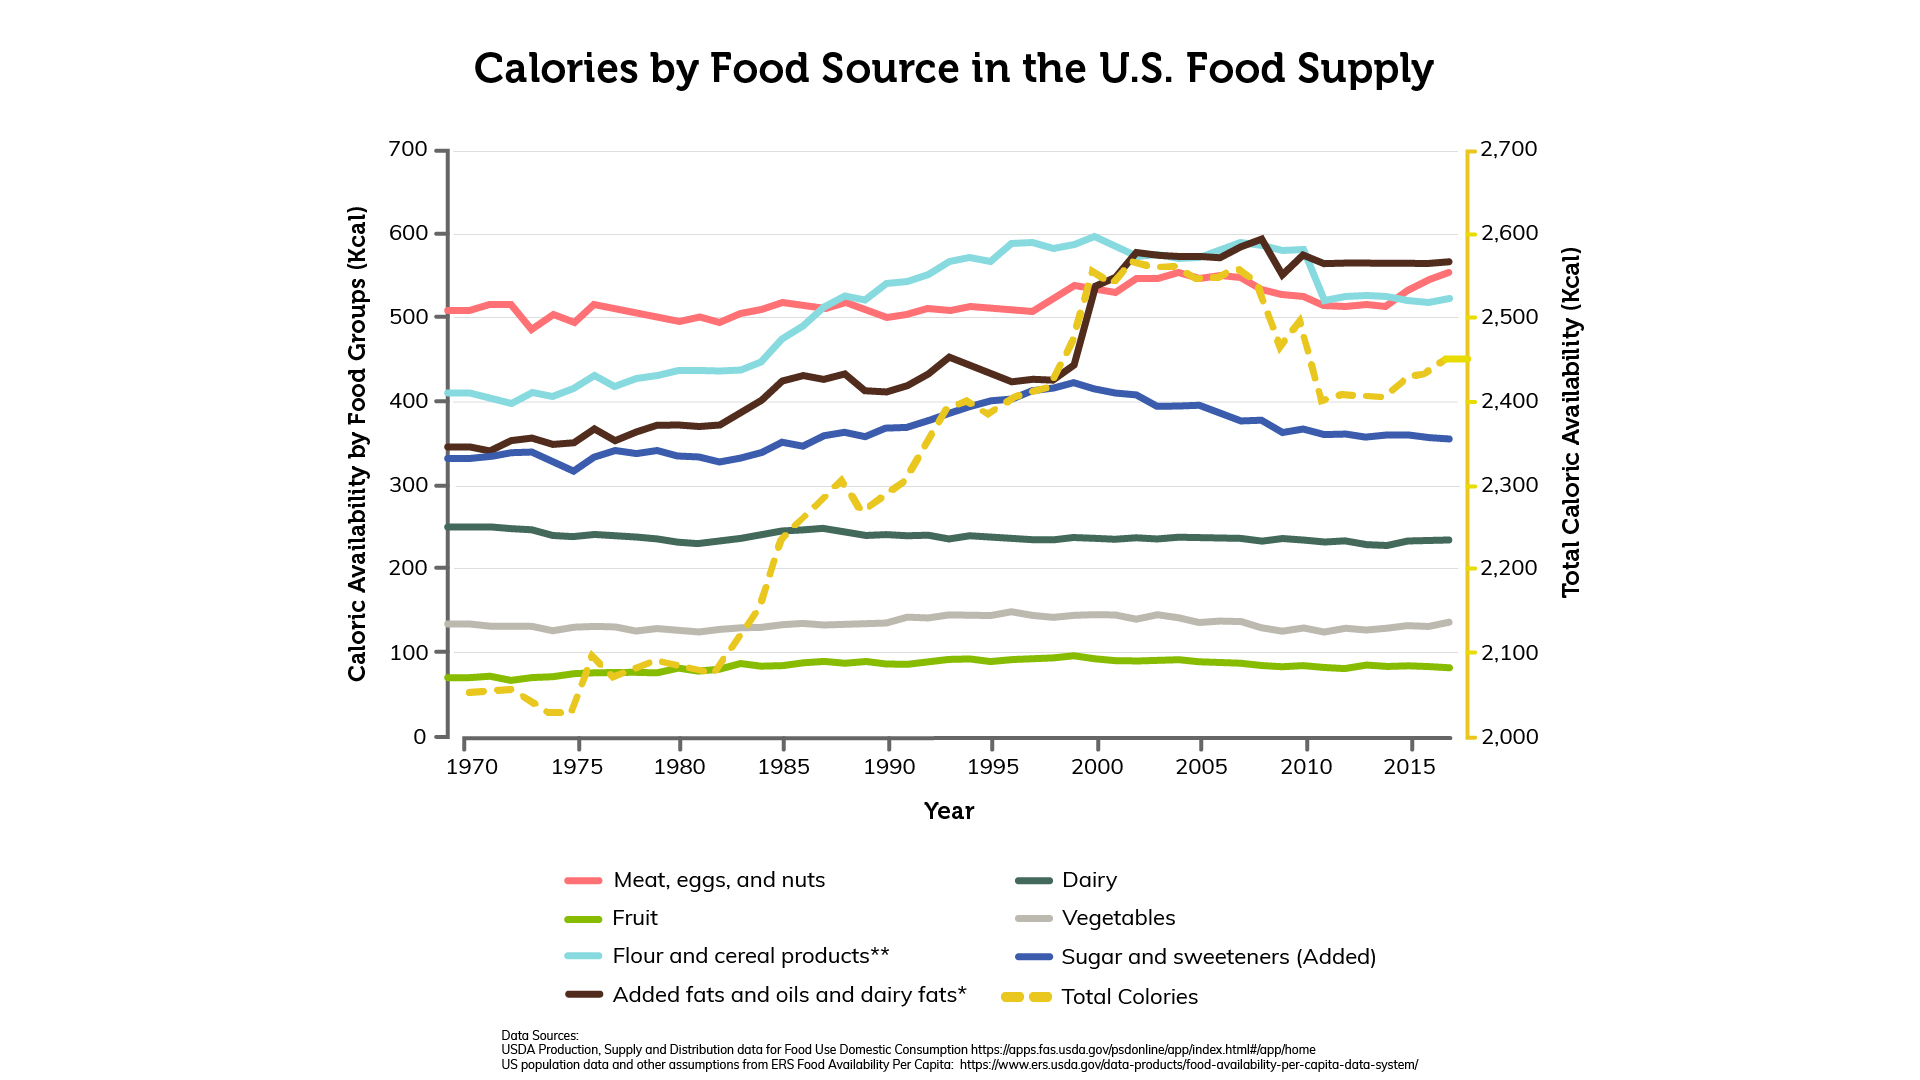
Daily per capita total calories and calories from added sugars, added fats and oils, and grains1
| Year | Added Sugars | Grains | Added Fats and Oils | Total Calories |
|---|---|---|---|---|
| 1970 | 333 | 410 | 346 | 2,054 |
| 1980 | 335 | 437 | 372 | 2,084 |
| 1990 | 369 | 541 | 411 | 2,287 |
| 2000 | 415 | 596 | 537 | 2,561 |
| 2010 | 367 | 581 | 575 | 2,501 |
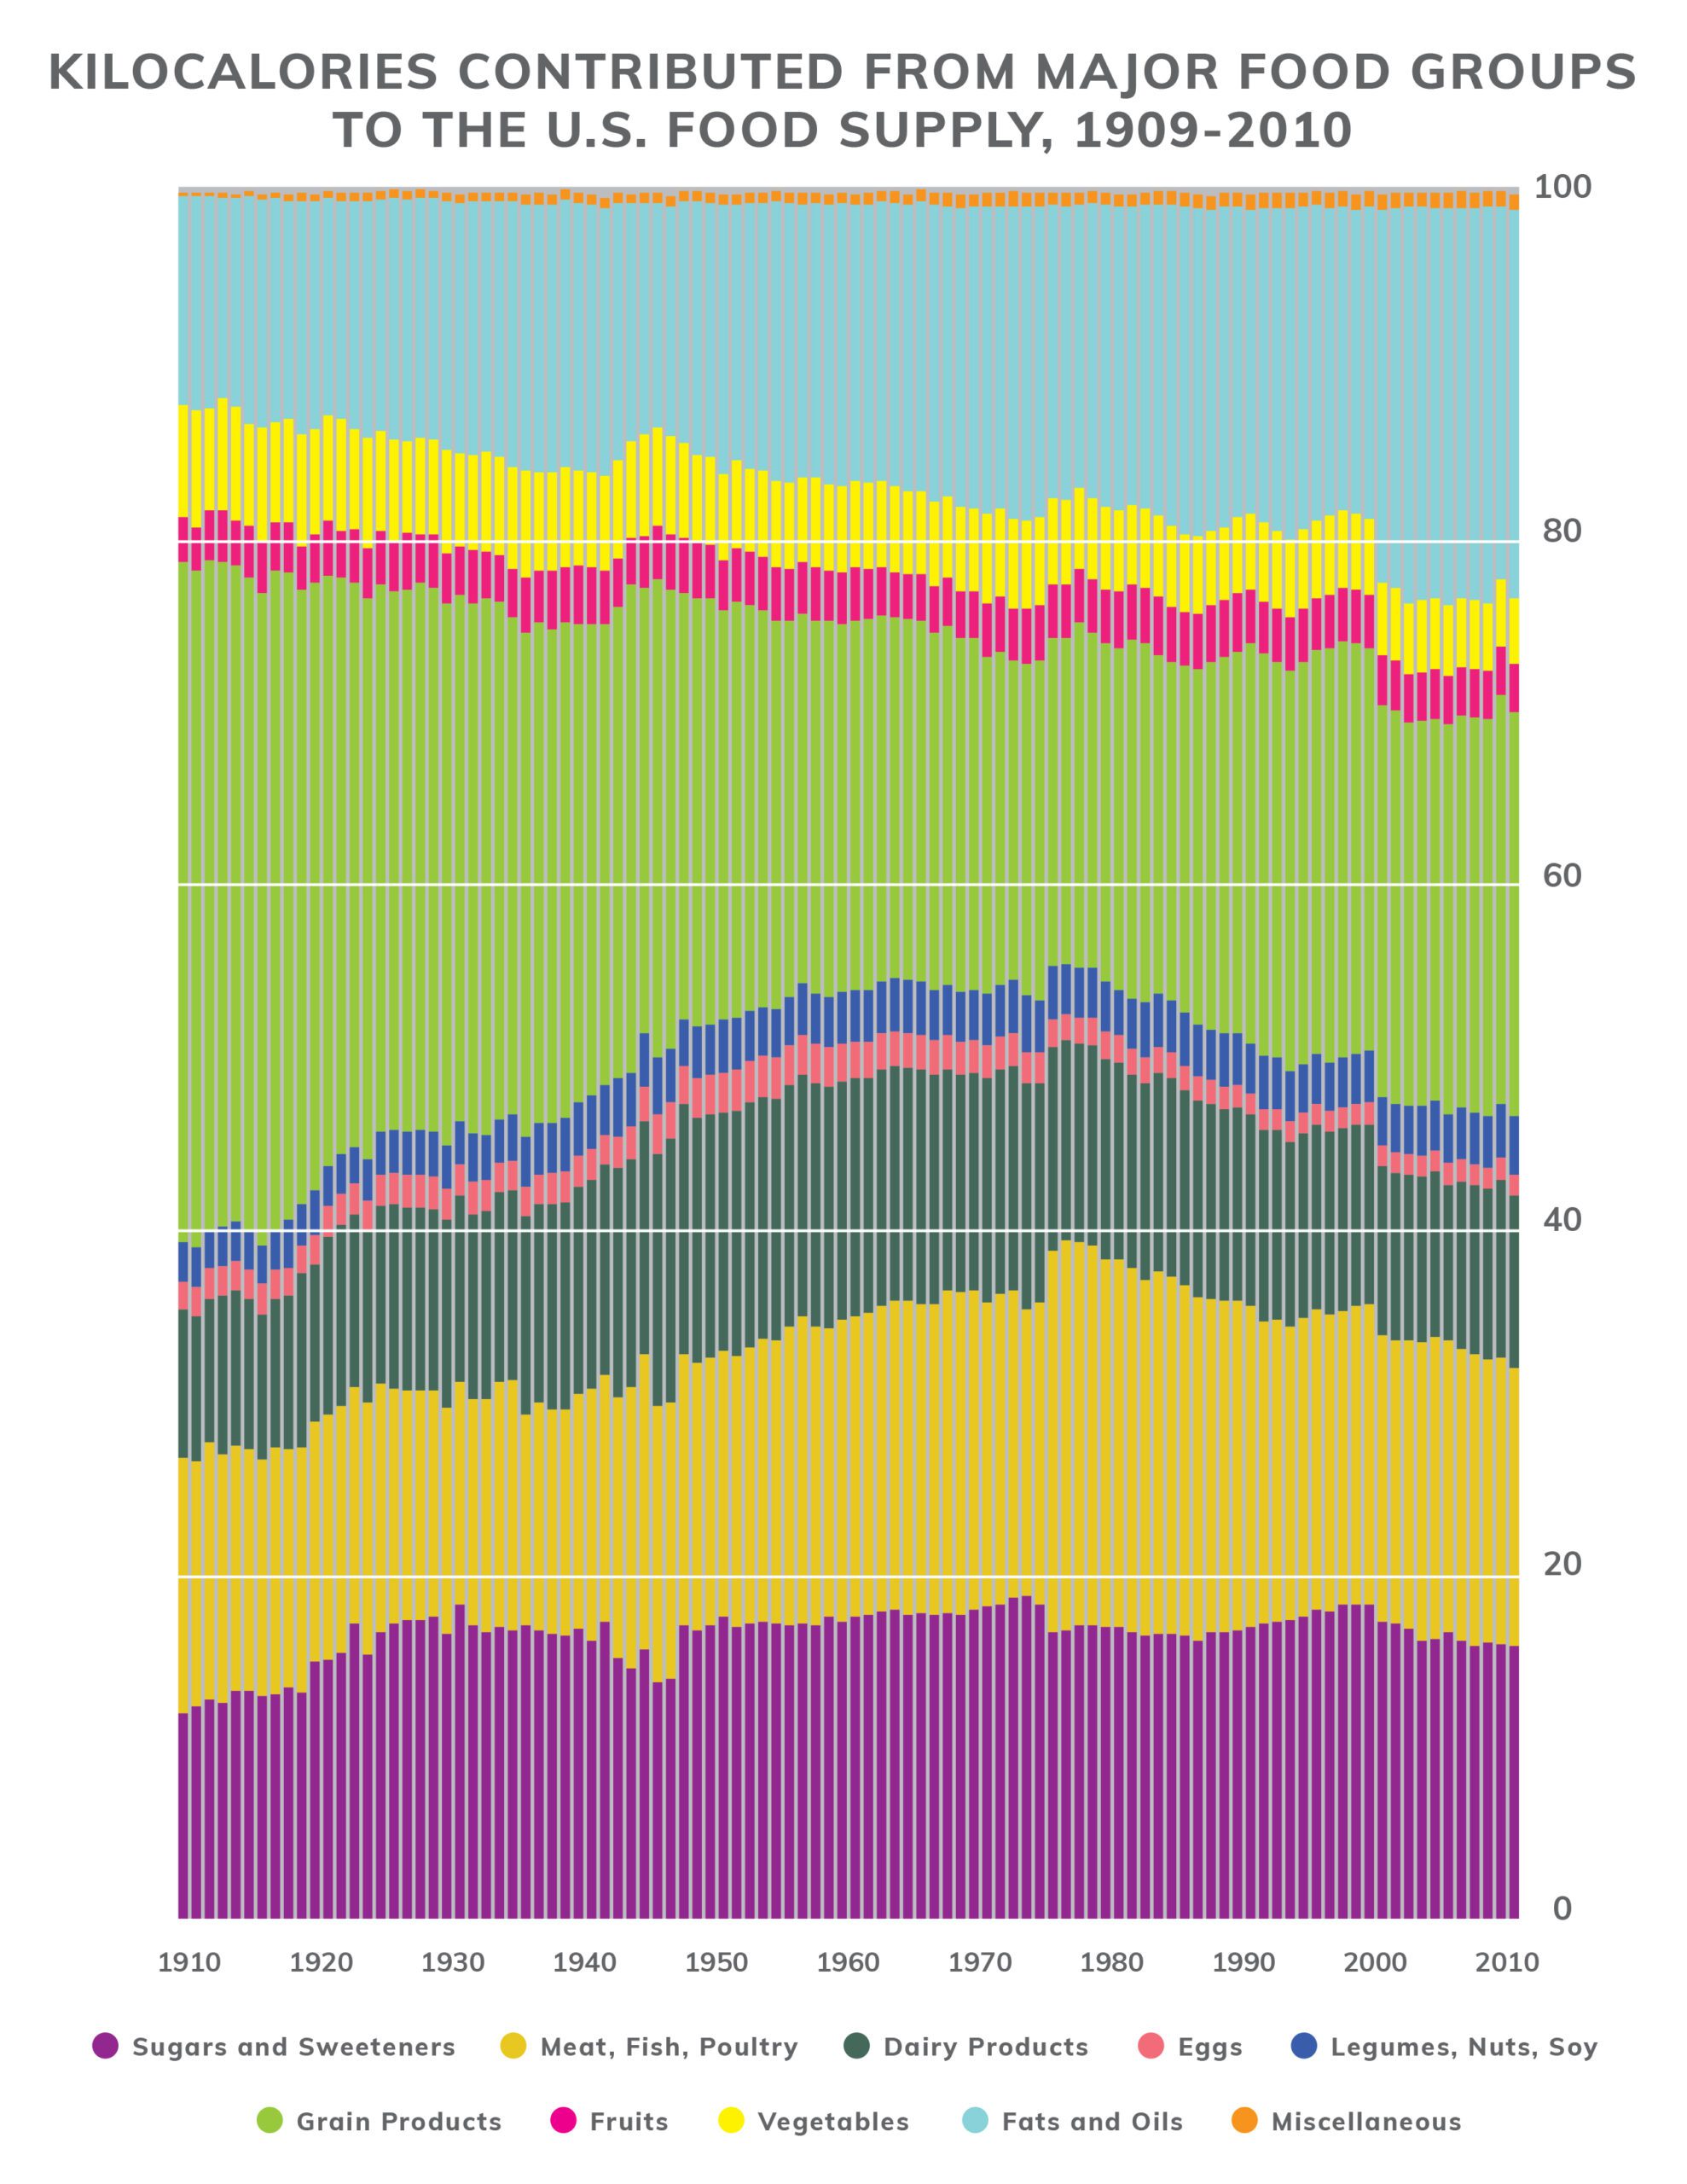
Going wayyyy back – total diet perspective
References:
Food availability (per capita) data system: Loss-adjusted food availability documentation. USDA ERS. Updated August 26, 2019.
- U.S. Department of Health and Human Services. Physical Activity Guidelines for Americans, 2nd edition. 2018. Available at: https://snaped.fns.usda.gov/library/materials/physical-activity-guidelines-americans-2nd-edition. Accessed July 17, 2023.
Ladabaum U, Mannalithara A, Myer PA, Singh G. Obesity, Abdominal Obesity, Physical Activity, and Caloric Intake in US Adults: 1988 to 2010. Am J Med. 2014;127(8):717-727.e12
- U.S. Department of Agriculture. U.S. Trends in Food Availability and a Dietary Assessment of Loss-Adjusted Food Availability, 1970-2014, January 2017. Available at: https://www.ers.usda.gov/webdocs/publications/82220/eib-166.pdf?v=42762.
- U.S. Department of Agriculture, Center for Nutrition Policy and Promotion. Nutrient Content of the U.S. Food Supply, 1909-2010. Available at: https://www.cnpp.usda.gov/USFoodSupply-1909-2010. Accessed April 10, 2018.
Sugar in the Total Diet
Let’s put added sugars and sugar intake into perspective of the total diet.
Learn MoreSources of Added Sugars
Sugar is added to food for lots of reasons. Read more to learn the most common sources of added sugars in Americans’ diets.
Learn More