We all know that obesity is a serious problem in the United States. With that in mind it should come as no surprise that as a society we eat more calories and move a lot less than we did 50 years ago1, 2, 3
In 1970, people were consuming 2,054 calories each day. Fast-forward to 2010 (the most recent calorie data), and that figure jumped to 2,501—more than a 20% increase in calories. But added sugars didn’t make up a very big percentage of the increased intake. Over that same period, added sugars consumption increased by 34.5 kcals/day, a 10% increase. Calories from added fats and oils have increased by 229 kcals/day, a 66% increase, and calories from grains have increased by 171 kcals/day, a 42% increase.1 These numbers are based on food availability data, which can be used as a proxy for consumption.

| Year | Added Sugars | Grains | Added Fats and Oils | Total Calories |
|---|---|---|---|---|
| 1970 | 333 | 410 | 346 | 2,054 |
| 1980 | 335 | 437 | 372 | 2,084 |
| 1990 | 369 | 541 | 411 | 2,287 |
| 2000 | 415 | 596 | 537 | 2,561 |
| 2010 | 367 | 581 | 575 | 2,501 |
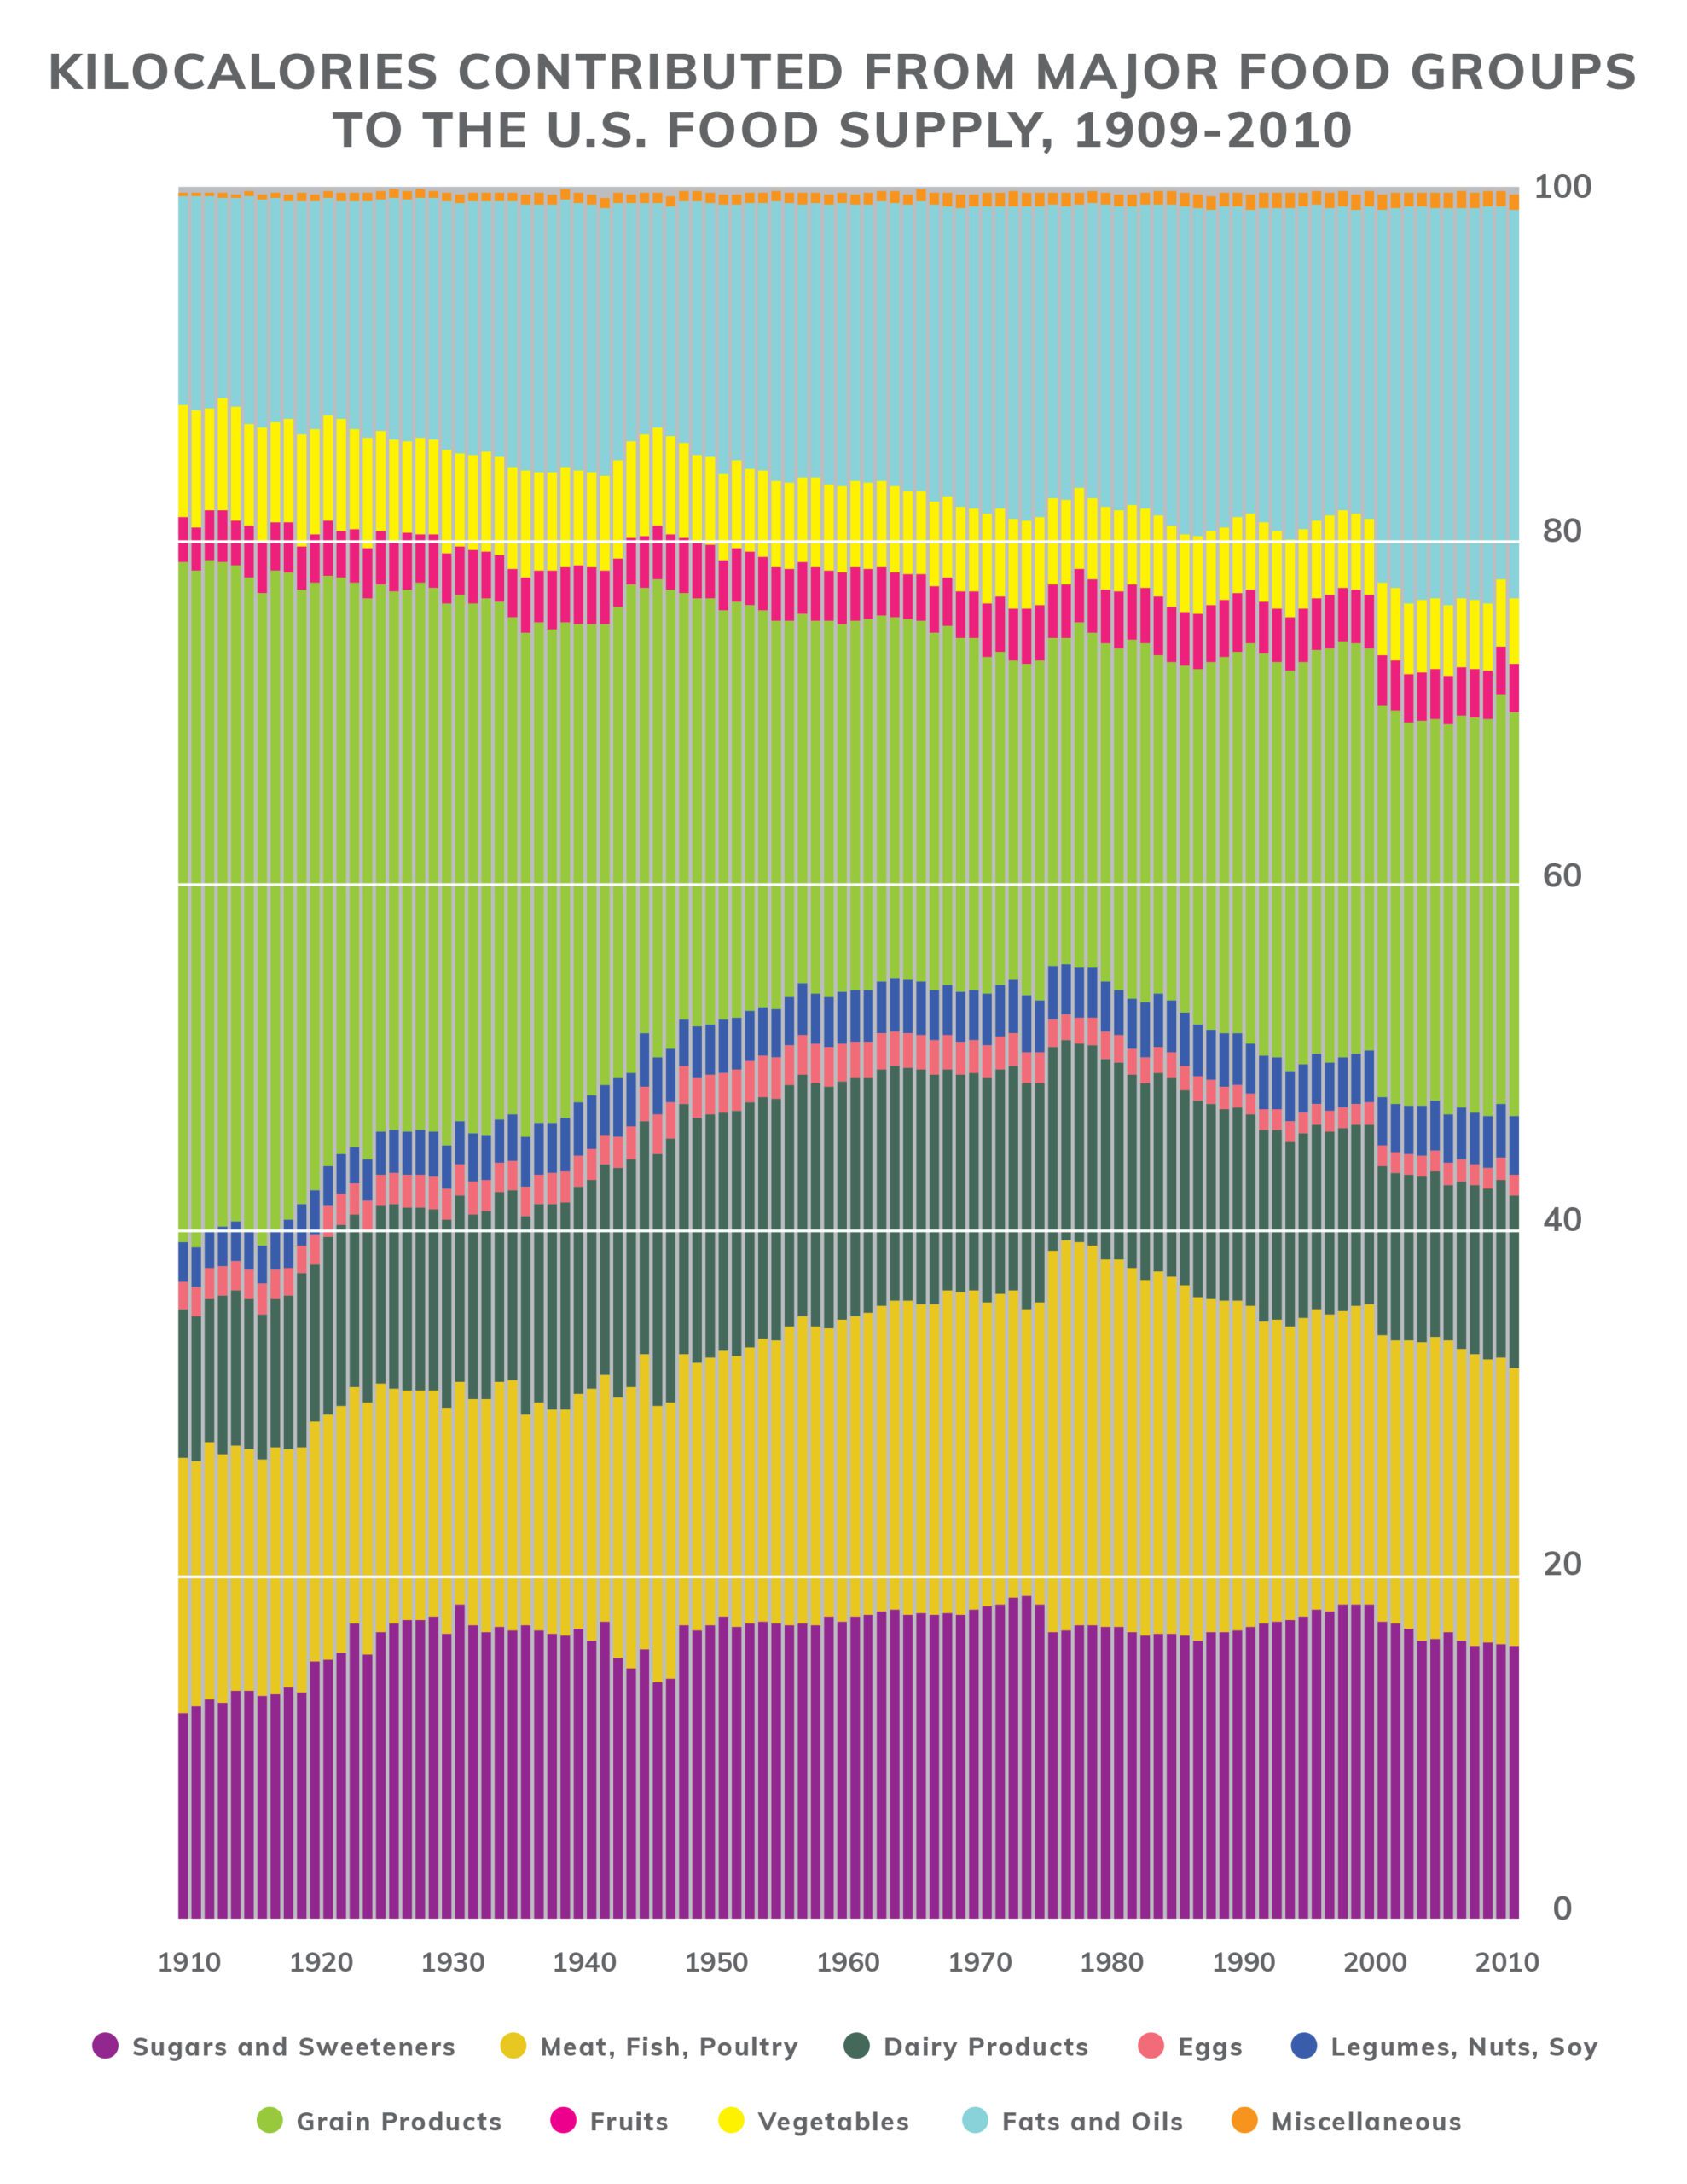
The calories contributed by major food groups have shifted over the years. Here’s a look at the makeup of the total calories in our diet and the way they’ve changed since 1909.5
1. Food availability (per capita) data system: Loss-adjusted food availability documentation. USDA ERS. Updated August 26, 2019.
2. U.S. Department of Health and Human Services. Physical Activity Guidelines for Americans, 2nd edition. 2018. Available at: https://snaped.fns.usda.gov/library/materials/physical-activity-guidelines-americans-2nd-edition. Accessed July 17, 2023.
3. Ladabaum U, Mannalithara A, Myer PA, Singh G. Obesity, Abdominal Obesity, Physical Activity, and Caloric Intake in US Adults: 1988 to 2010. Am J Med. 2014;127(8):717-727.e12
4. U.S. Department of Agriculture. U.S. Trends in Food Availability and a Dietary Assessment of Loss-Adjusted Food Availability, 1970-2014, January 2017. Available at: https://www.ers.usda.gov/webdocs/publications/82220/eib-166.pdf?v=42762.
5. U.S. Department of Agriculture, Center for Nutrition Policy and Promotion. Nutrient Content of the U.S. Food Supply, 1909-2010. Available at: https://www.cnpp.usda.gov/USFoodSupply-1909-2010. Accessed April 10, 2018.
Sugar is added to food for lots of reasons. Read more to learn the most common sources of added sugars in Americans’ diets.
Learn More© 2026 The Sugar Association, Inc. All rights reserved.


Get Social with #MoreToSugar